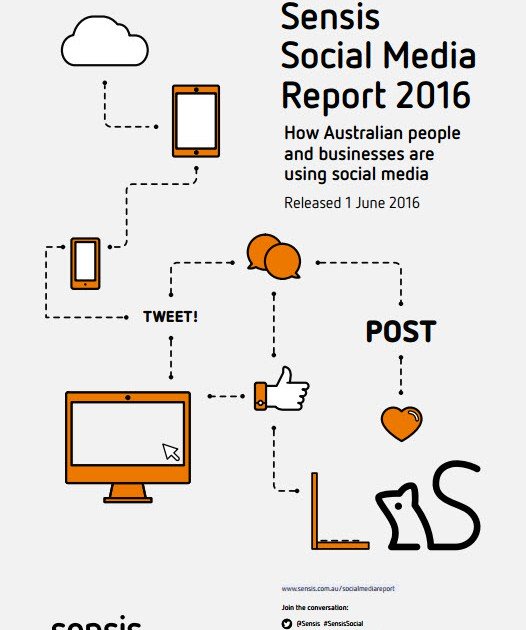
How Australian people and businesses are using social media
Released 1 June 2016
We’re always excited about the release of our annual Sensis Social Media Report. Now in its sixth year, the report has become a crucial insight and benchmarking tool for all business owners.
This is a fairly substantial 71 page report done on 1000 Australian businesses and 800 Australian Consumers so we have done all the reading of the report and extracted the important parts for you.
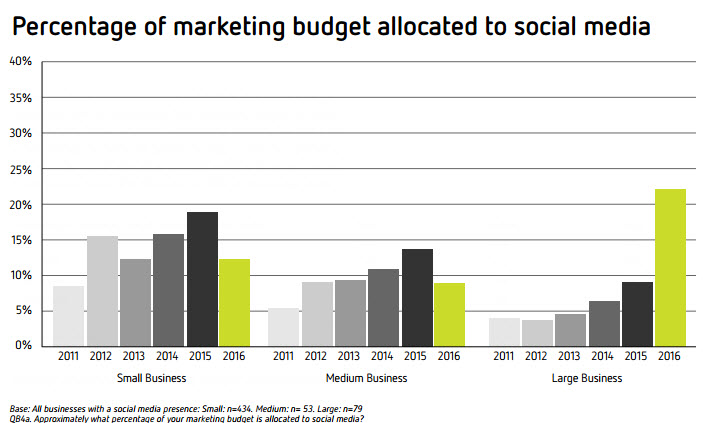
Australians are now spending more than half a day per week (12.5 hours) on Facebook alone, up four hours from last year
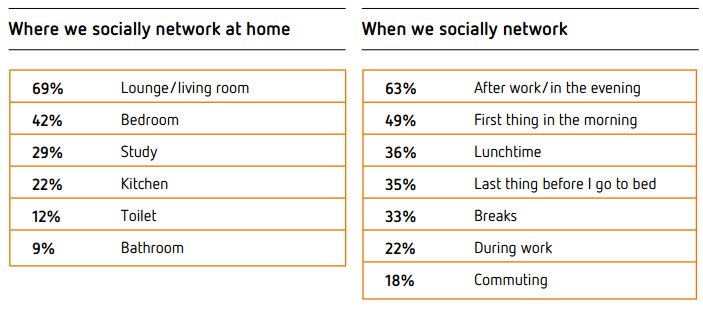
Indeed, Australians are now spending more than half a day per week (12.5 hours) on Facebook alone, up four hours from last year. This should be a wake-up call for businesses that aren’t yet on social media – this is where your customers are, and this is where you can engage with them. This is especially pertinent considering frequency of access is increasing, with most consumers accessing social media sites every day or multiple times per day.
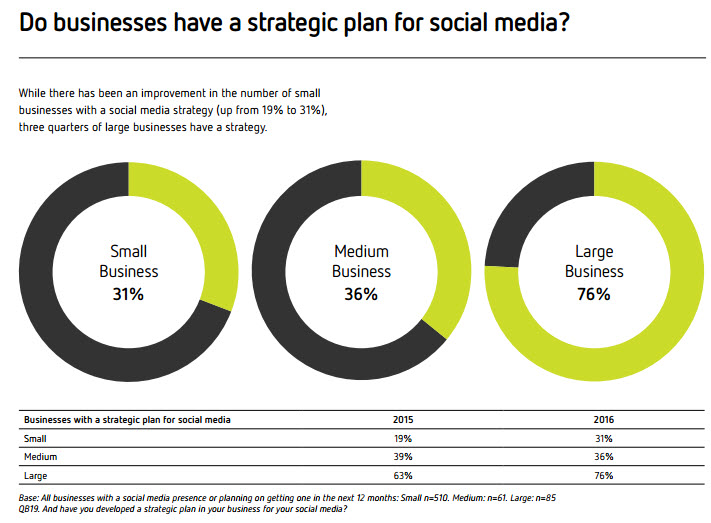
And it seems like many businesses are taking notice, with an upsurge in the number with a social media presence for all business sizes (31% to 48% for SMBs, and 56% to 79% for large businesses). There is still a gap, though, in how frequently consumers are using and engaging with social media as compared to businesses. This disconnect is a key opportunity for Australian businesses to get an edge on their competitors.
For the first time ever, smartphones are the most popular device owned by consumers, having eclipsed laptops.
For the first time ever, smartphones are the most popular device owned by consumers, having eclipsed laptops. When creating content, businesses must take into consideration where, when and how their audience is going to absorb that information and have a “mobile first” mentality. But beyond optimising content for mobile, businesses should first have a clear understanding of who their target audience is. Younger people are still using social media differently to the older demographic, with a definite skew towards more visual platforms like Facebook, Instagram and Snapchat for 18 to 29 year olds, and LinkedIn and Google+ for 40 to 49 year olds.
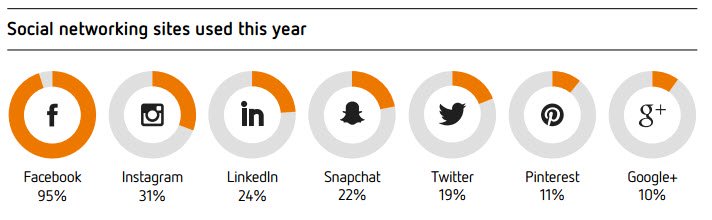
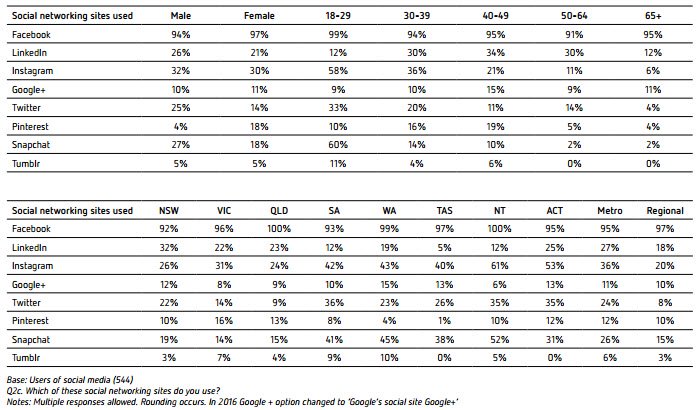
Facebook has maintained its almost ubiquitous appeal – 95% of users.
Facebook has maintained its almost ubiquitous appeal – 95% of users. The average number of times people access Facebook has remained relatively steady at 32 times a week, but the amount of time spent on each occasion has increased from 17 to 24 minutes.
There is also more trust towards brands that interact with customers in a positive way on social media
There is also more trust towards brands that interact with customers in a positive way on social media, as well as make their content engaging, relevant and keep it regularly updated. One risk is excessive content, which was identified as one of the more influential factors by those who stopped following any company or brand. It therefore appears to be more a question of how, rather than if, businesses and marketers should use social media to connect and engage with consumers meaningfully and effectively. Many hesitant SMBs are now embracing social media, with even more intending to add a presence in the year ahead. Businesses are increasingly convinced that social media investment will help increase sales – 62% of SMBs and 68% of large businesses.
Smartphones are now the most popular device, overtaking laptops which have lost some appeal.
Smartphones are now the most popular device, overtaking laptops which have lost some appeal. Wearable devices such as Apple watches and Fitbits are now worn by 6% of people. Smartphones are distinctly more popular in metropolitan areas than regional, unlike laptops. Smartphones also achieve a clearly above average penetration in both the Northern Territory and the ACT. In WA and the NT ownership incidence of both tablets and desktops is well below the average. SA residents also find tablets and devices like the iPod Touch less appealing than most.
Snapchat has become more appealing in the last 12 months, with usage rising from 15% to 22%.
Facebook dominates in terms of usage with 95% of social networkers maintaining a Facebook profile (93% last survey). It is used by more than 90% of males and females, in each age group and across all locations. In some locations it is used by 100% of people. Among the other platforms, Instagram is on a growth path, while LinkedIn was less popular than in 2015. LinkedIn usage remains higher among males, those working full-time and higher income earners, as well as those in the 30-64 age bracket. Google+ mentions were also lower but this is potentially due to a change in the description for clarification purposes to avoid confusion with Google search. Twitter users appear to have increased marginally relative to 2015. Snapchat has become more appealing in the last 12 months, with usage rising from 15% to 22%. Visual platforms such as Instagram and Snapchat appeal mostly in the younger age groups, particularly under 30s. Males use Twitter and Snapchat more, while Pinterest is more popular among females.
Twitter continues to be the most common platform people have stopped using
28% of people use social media to watch videos
43% of 18-29 years olds use social media to watch videos
Females mentioned most of the shopping and research related reasons more than males, while the opposite applied for watching videos, following celebrities, meeting friends and meeting people with the same interests.
most Australian Internet users (60%) read online reviews or blogs
It continues to be the case that most Australian Internet users (60%) read online reviews or blogs, and while this incidence is greater than in 2015, it remains behind prior observations. This year’s growth has been driven more by females than males, and by the 40 plus age group than younger people. In fact the under 30 age group have become significantly less interested in online reviews and blogs since 2013 – down from 80% to 59% now. Queensland (70%) is the only location significantly above the national average on this measure with the NT (37%), WA (45%) and Tasmania (46%) quite far behind. Most readers are still likely to look at up to five reviews before making a decision, but some growth in the number of reviews consulted was indicated in the survey.
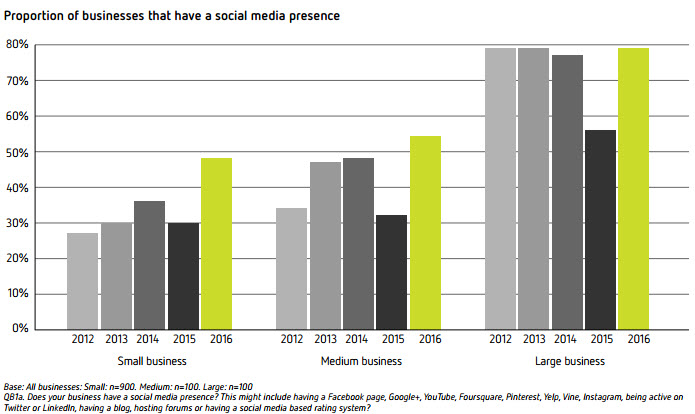
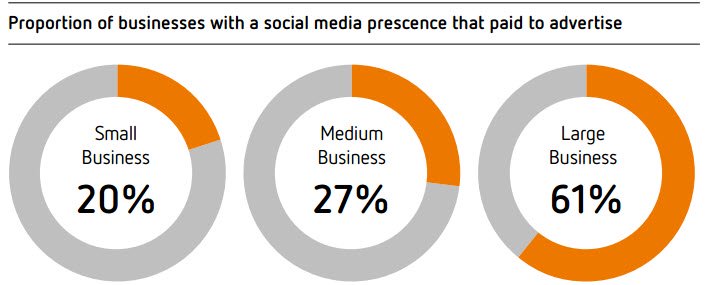
Forty eight percent of small businesses, 54% of medium businesses and 79% of large businesses are now on social media. Facebook continues to be the most popular platform by far.
Thanks for reading! 🙂
